Update from 2021 scholarship recipient Cassandra Newman
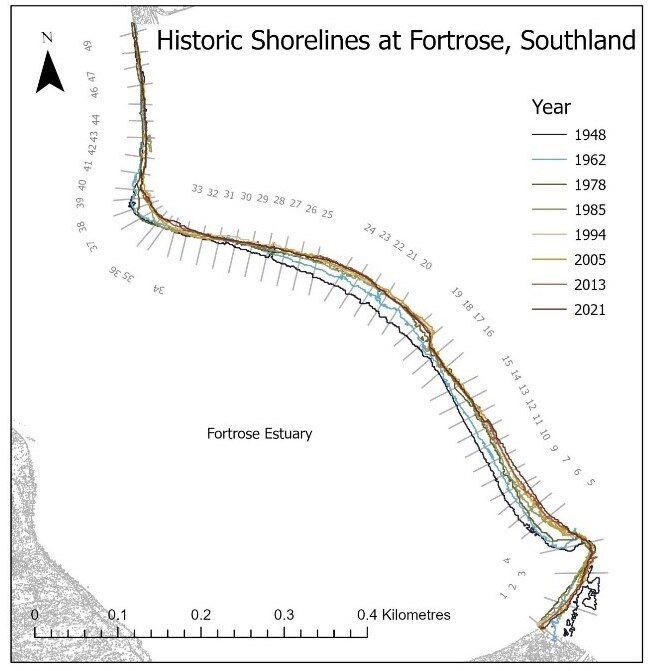 Figure 1 Historic Shorelines at Fortrose captured by satellite imagery
A nationwide lockdown has been an efficient way to glue me to my research over the past couple of months. I managed to capture my August UAV imagery and get back to Auckland just before the country went into lockdown. Three surveys of UAV imagery have been collected with a final due November. Because of lockdown restrictions, this survey may have to be delayed until December but if I am unable to leave Auckland until next year, the final survey trip down to Southland will be cancelled. This is not ideal as the surveys I collected in May were unusable because of doming in my imagery so I will only have my February and August surveys. With two surveys, any analysis I do between them will be ‘linear’ whereas the coastal system is not linear so shouldn’t be measured as such.
I am undertaking analysis of the sites and beginning to interpret the results I have so far. This report just highlights 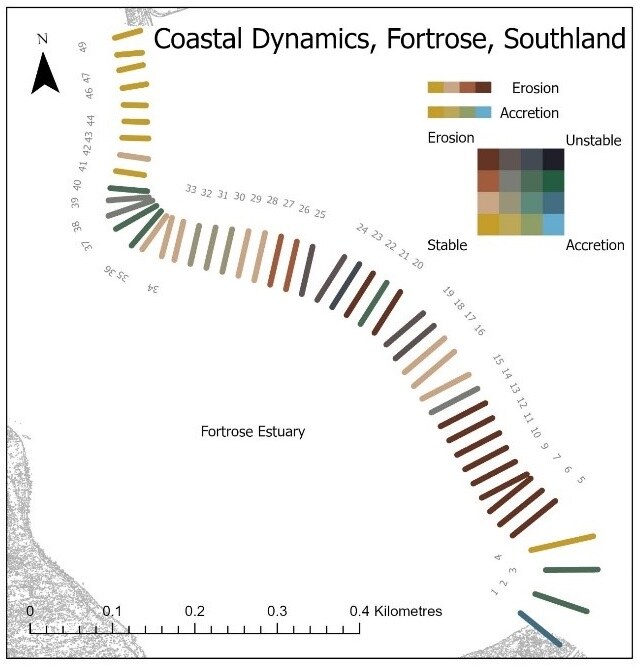 Figure 2: Coastal dynamics at Fortrose derived from patterns seen throughout historic shorelines.my outputs from the Fortrose site and shows an interesting observation found with my values table of Porpoise Bay.
Fortrose has been a very interesting site to investigate. This site is along the east side of the Fortrose estuary, at the mouth of the Mataura River in Southland (Fig. 1). The estuary is tidal, but the dynamics of this shoreline rely greatly on the flow of the Mataura River just before it reaches the sea. Old CAD files from the late 1800s show whole property boundaries around where transects 18 – 24 are, have been lost to erosion. In recent years, concrete, bricks, and driftwood have been pushed into the shoreline to prevent further erosion. The results of this can be seen in figure 1 where the lines representing the years 2005, 2013 and 2021 are close together. Is there a more efficient way to prevent the natural course of erosion along this shoreline than adding artificial material into the banks? If not, how do we manage 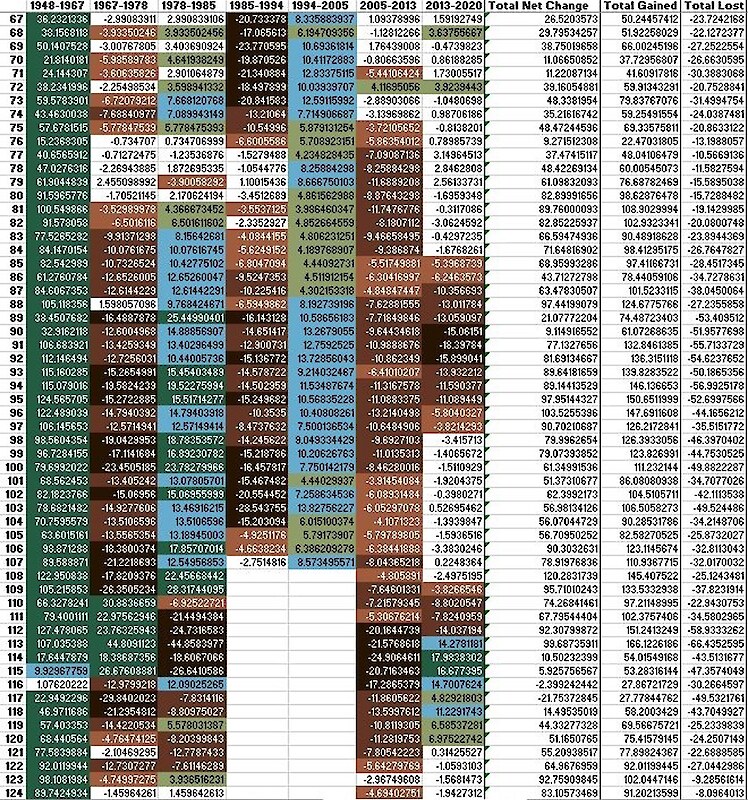 Figure 3: Snapshot of Porpoise Bay magnitude values with key showing distinct cycles of erosion and accretion between each surveythe retreat of the shoreline? I look forward to investigating this site further.
A big part of GIS for me is making geographical information easy to interpret and understand no matter your background. A degree in design would have been helpful but none the less I have spent some time formatting my data output so the information they are conveying is transparent. Figure 2 shows my coastal dynamics map where I created a matrix to categorise each transect between the four dynamics: eroding, accreting, stable and unstable.
The most interesting observation I found was when analysing the Porpoise Bay magnitude and rate of change values. There is a distinction erosion / accretion cycle occurring about every 10 years. Figure 3 shows a snapshot of the magnitude values between each historic shoreline at Porpoise Bay and Figure 4 shows the average annual rate of change. The cells highlighted in browns are erosion and in green and blue are accretion. Because of the complex system Figures 3 & 4 are 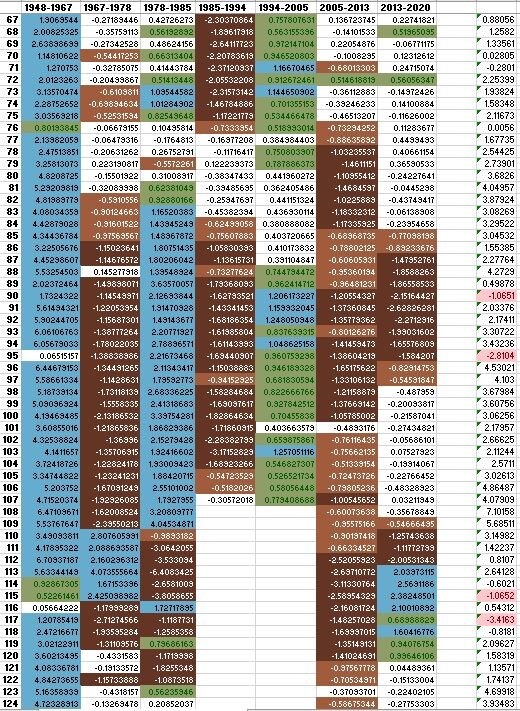 Figure 4: Snapshot of Porpoise Bay average annual rate of change showing distinct cycles of erosion and accretion between each surveyshowing over the years, deciphering patterns, or making predictions of this site has proven difficult.
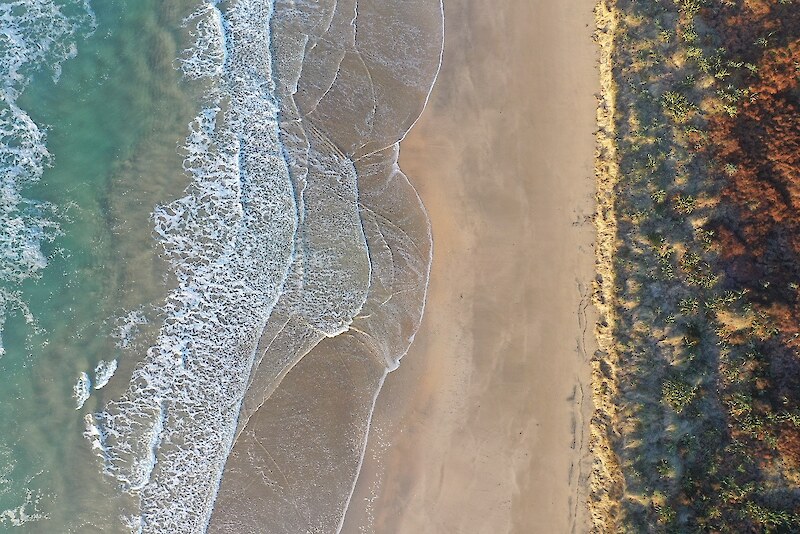
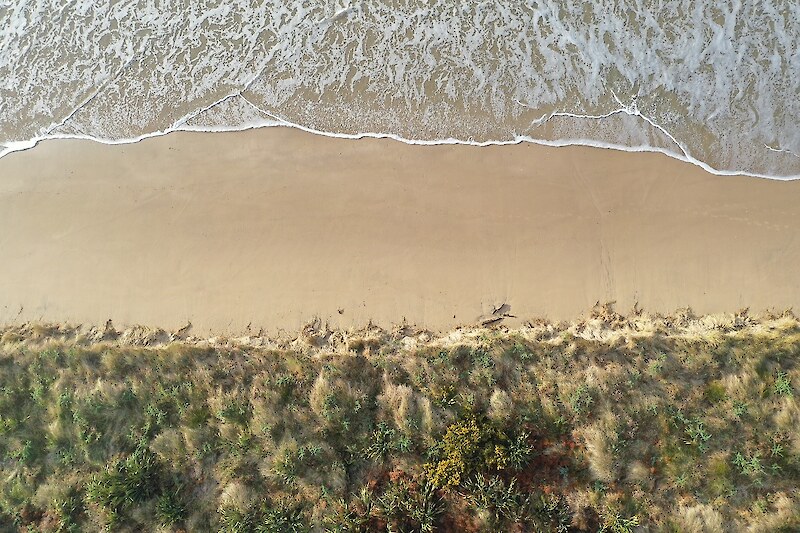
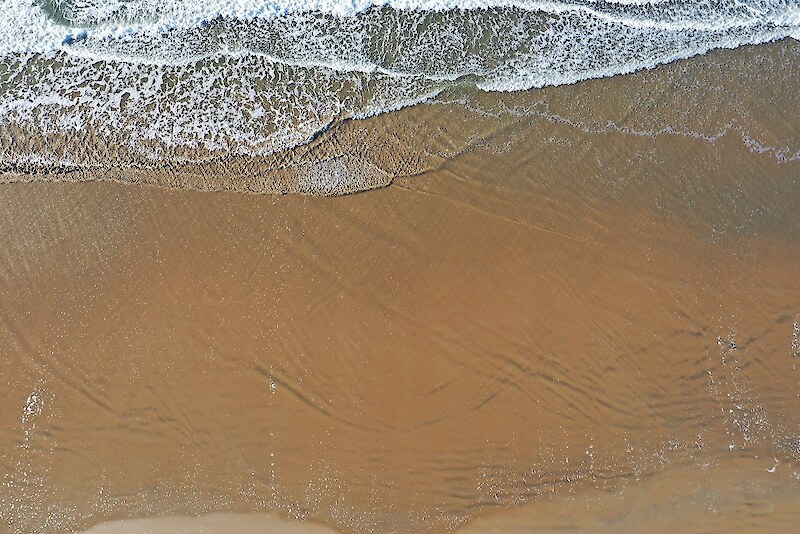
I am over halfway through with my thesis and am enjoying this research immensely. I have learnt a lot so far, especially with different methods for collecting drone imagery and how to problem solve when things do not go the way you plan them to. The drone surveys have also captured some stunning aerial images of the shore. These images below are from the Porpoise Bay August survey. These images (plus a couple hundred more) are processed to create the 3D models of the sites.
Posted: 26 November 2021 in the News category